Charts and Graphs
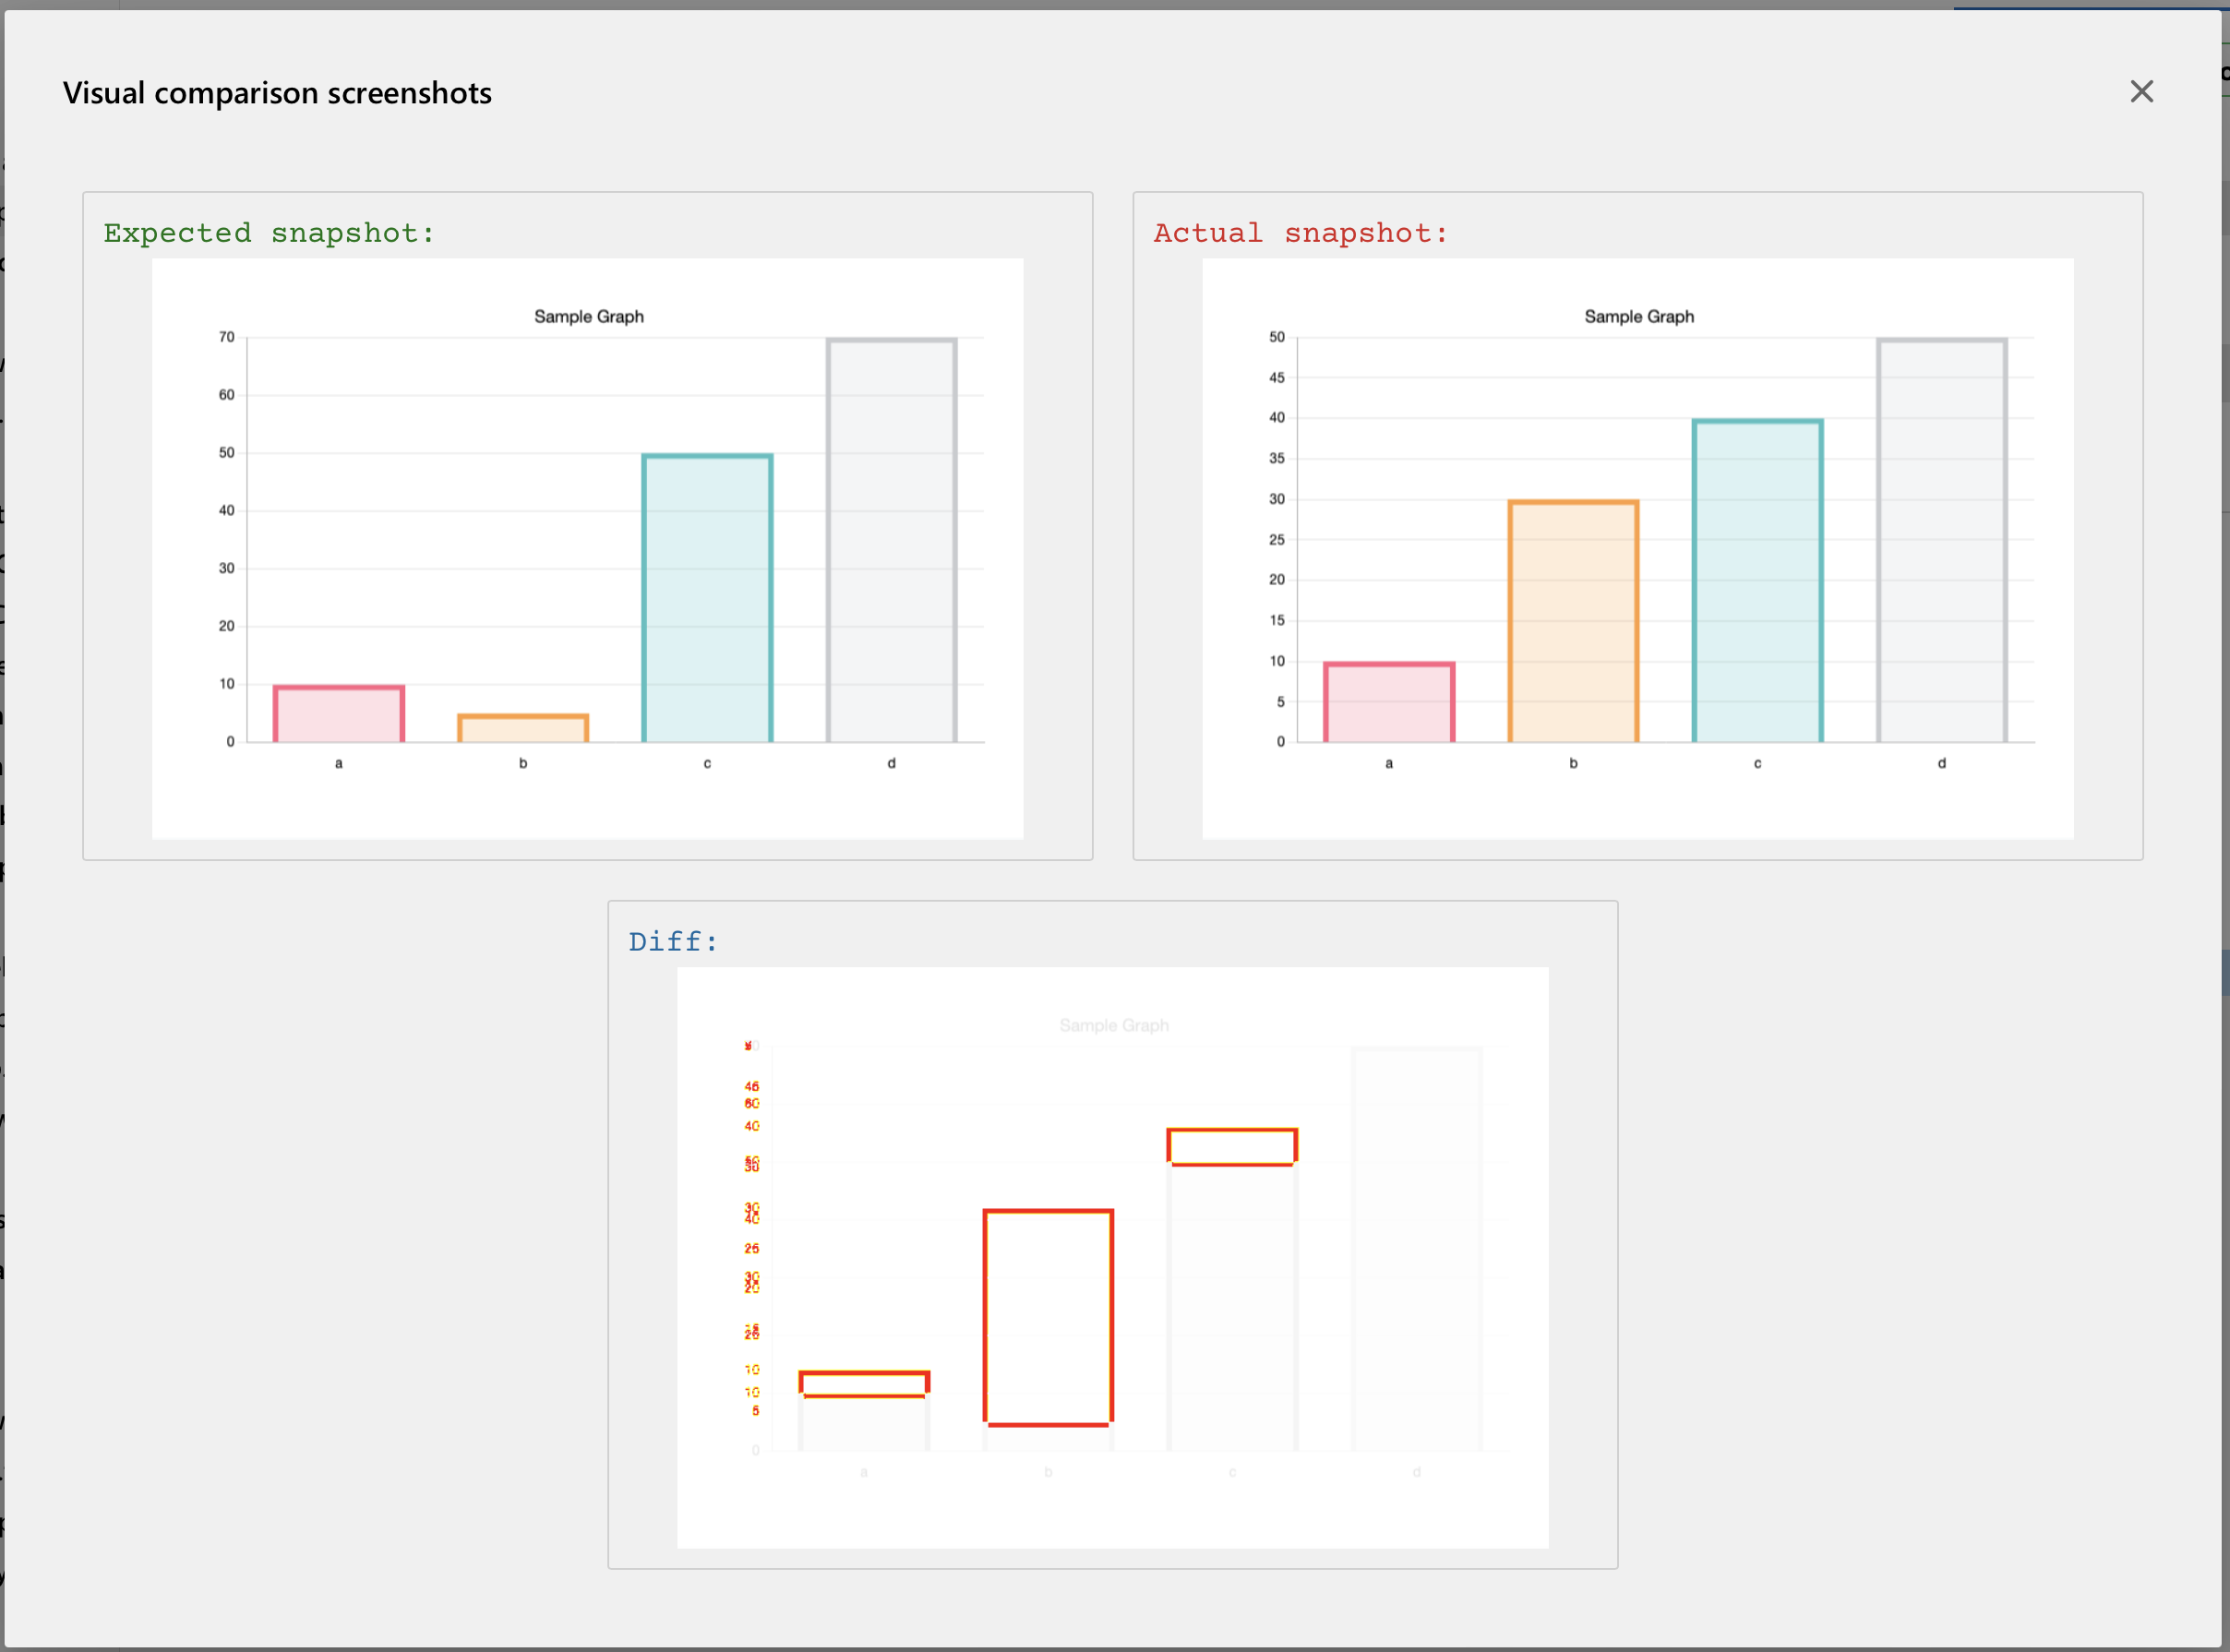
While functional validation is key to UI automation, visual regressions also need to be validated. DevAssure offers in-built actions that can be customised to visually validate Charts and Graphs in Dashboards.
Other use cases of visual regressions include validating images, icons, colors, fonts, and other UI elements.
Learn more about Visual Validation with DevAssure
- Getting started: /docs/DevAssure/Visual%20Testing/visual-testcase/
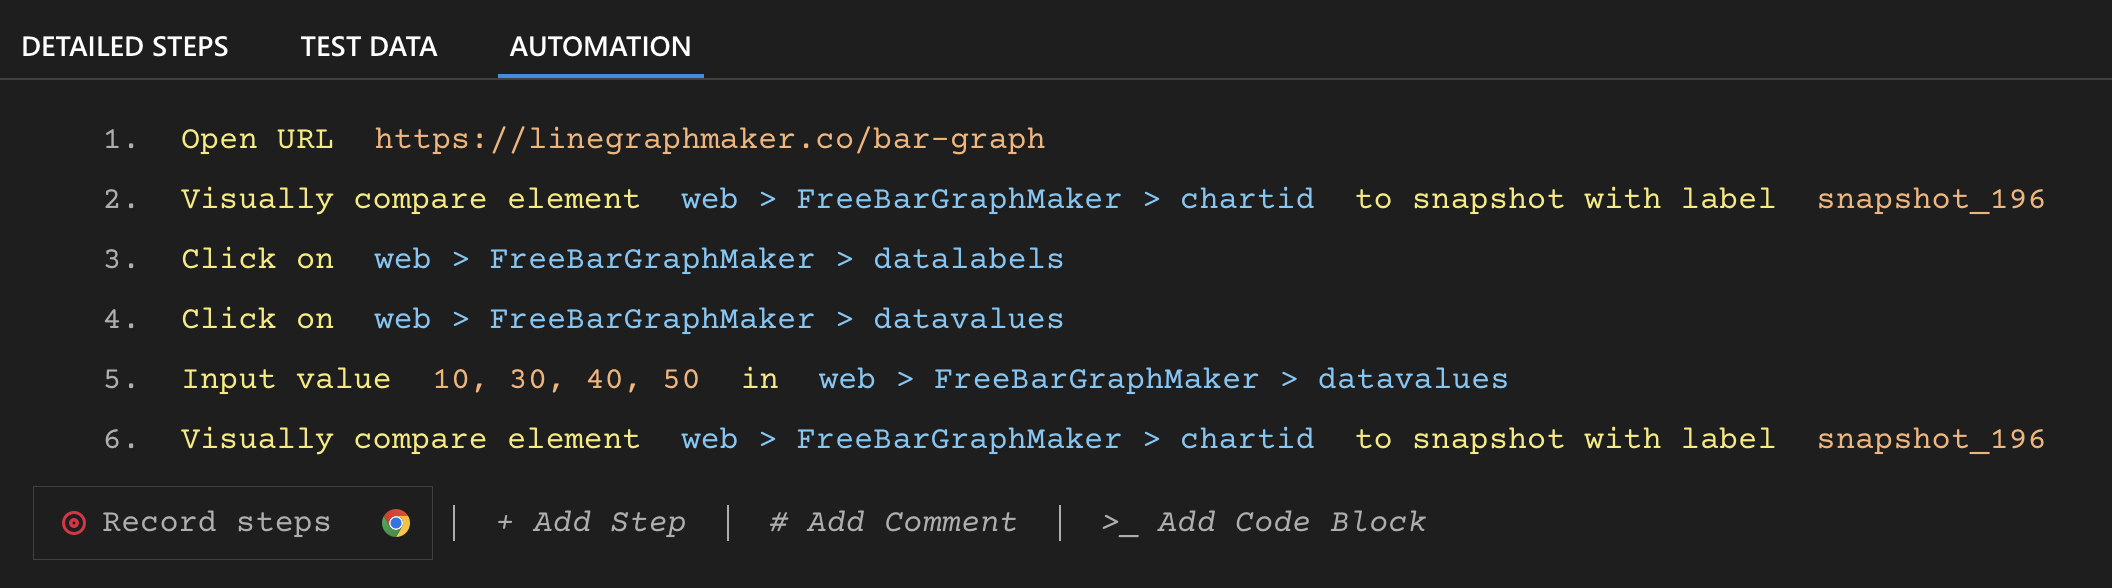
Visually Validate the graph rendered
Case Study
Profit.co Automated UI checks that increased release confidence and caught inconsistencies early..
🔗 Explore the Profit.co Case Study
Report output