What is a Test Automation Report and Why is it important?

Test automation enables engineers to validate and test features and bug fixes at a faster rate. Test automation is primarily useful for regression testing. But is it enough to develop the automation scripts alone? Test automation is incomplete without reporting. Test automation reports help QA engineers to analyse the test results in a cumulative manner, specifically failures, and validate if they are actual issues or flaky tests.
That need has only grown. Teams now ship multiple pull requests per day — often with code written or assisted by AI — and need reports that answer a sharper question: did this specific change break real user behaviour? DevAssure O2, our autonomous testing agent, was built with that in mind: every run produces a detailed HTML report with session recordings, step-level pass/fail, and bug analysis you can open locally or attach to a PR check.
In this blog, the focus is on automation reports and dashboards — the key metrics that simplify report analysis, how open-source tools handle reporting, and how DevAssure O2 and the DevAssure platform deliver it end to end.
Key components in a test automation report
Summary
A high level summary of the complete test suite execution providing details like -
- No of tests executed
- Failed and passed tests count and percentage
- Test execution time
- Test execution environment details
- Browsers and devices
Test Case List and Filters
Every report will contain a list of test cases executed along with the status - Pass/Fail/Skipped. Additionally there will also be filters available for filtering the test cases based on status, tags etc.
Test Steps
Each test case will contain details like browser, execution time and resolution. Each test case will also contain the test steps in detail and will clearly depict at which step the test case has failed for failed test cases. In some reports, the execution time for each test step will also be mentioned. This is greatly useful to debug tests that take a longer time to execute and which can be used to eventually reduce the test execution time and overall execution time of the test automation suite.
With DevAssure O2, each plain-English step in your YAML test case maps directly to a row in the report — so when "Verify the discount is applied" fails, you see exactly which intent failed, not a stack trace pointing at a stale CSS selector.
Screenshots and Screen Recordings
For failed test cases, a proof in the form of screenshots or screen recordings should be made available which will further enhance the failed test case analysis and help debug the failures and identify the root cause of the failure.
Session recordings are especially valuable for autonomous agents that interact with the UI the way a human would. O2 captures full browser sessions per test, so reviewers can replay what the agent saw and clicked — not just a final screenshot at the moment of failure.
Reasons for Failed Tests
This is the most important parameter in a test automation report. The exceptions for the failed tests help identify the reason for the test failure and there-by help detect bugs in the application or feature.
O2 goes further by classifying failures as functional bugs (the feature does not work) or usability bugs (the UI confuses or blocks the user), with natural-language reasoning attached to each failure.
Network Logs and Console Logs for UI Tests
This is another useful parameter in a test automation report that helps debug test failures and also detect any performance issues. Network and console logs can also be used to identify the root cause of the failure and will help developers fix the code faster. This is primarily useful when the bugs are not easily reproducible, in which case such network and console traces will help narrow down the root cause of the bug.
Key Data to Track in a Test Automation Report
Here are some of the key parameters that can be used for analysis of test automation jobs -
- No of tests - Total no of tests executed within a single automation job
- No of jobs - Total no of automation jobs added and executed
- Automation job status - Automation job status can be any one of Pass/Fail/Running/Cancelled.
- Passed tests - Can be count or percentage
- Failed tests - Can be count or percentage
- Skipped tests - Can be count or percentage
- Exceptions - Reasons for test case failures. Can be used to group failed test cases based on similar exceptions, thereby reducing the overall time spent to analyse individual tests that have failed because of the same reasons.
- Execution time - Can be computed for independent test steps, test cases, entire job
- Test case stability - helps understand the overall stability of the test case across different jobs and environments. This will help fix flaky tests.
- Environments - Depicts which environments the tests were executed across different automation jobs. Eg) DevBox, Beta, Sandbox, Production etc
- Tags - Help group tests that belong to the same functionalities
- Priority - Help group tests based on priorities
For PR-native testing, add one more dimension: change scope. Reports should tie results back to the diff that triggered the run — which flows were affected, which tests were generated or selected for that change, and whether the failure is a regression introduced by this PR or a pre-existing issue.
Building Analysis using Test Automation Results
Using the above mentioned parameters, some of the key metrics that can be built are -
- No of tests executed over a period of time and depiction of the failure rate in each execution
- Categorise test cases and status by tags and features and priorities
- Test case stability rate
- Average Test execution time
- Group test cases by exceptions
- Total number of test cases added over a period of time
- Test case failure and pass rate trends
- Clusters to help identify which code branch caused which test to fail when tests are executed across multiple branches.
Open Source Test Automation Reports
Here are a few sample test automation reports being widely used across teams -
TestNG Reports
TestNG is an open source framework for test automation. TestNG annotations are used along with Selenium automation in Java. TestNG generates html and xml based reports that cover basic details about the tests executed. Here's a good resource to help understand more about testng reporting: https://www.tutorialspoint.com/testng/testng_html_xml_report.htm.
Allure reports
Allure reports is an open source test automation reporting tool. It can be integrated with open source test automation tools like Selenium and playwright. One of the key advantages of allure reports is that it helps analyse historical data as well. Learn more about allure reports: https://allurereport.org/
Report Portal
Report portal is a test automation analytics dashboard - https://reportportal.io/. It provides real time analysis and also helps in data visualizations. One of the major advantages of ReportPortal is the usage of machine learning algorithms that help identify patterns and detect potential issues.
Extent Reports
Extent reports is an open source test automation reporting tool that integrates well with open source tools like TestNG - https://extentreports.com/.
It is widely used in Selenium Test Automation frameworks.
These tools work well when you already own a script-based suite. The trade-off is setup and maintenance: you wire Allure or Extent into your framework, keep plugins updated, and still debug failures caused by flaky selectors. Autonomous agents like DevAssure O2 ship reporting as part of every run — no separate reporting layer to configure.
DevAssure O2: Reports on every PR and CLI run
DevAssure O2 is an autonomous testing agent that reads your code changes, runs plain-English tests in a real browser, and produces rich reports automatically. There is no separate reporting plugin to install.
What every O2 report includes
- Pass and failure summary — counts, percentages, and execution time per session
- Step-level detail — each plain-English step with pass/fail status and timing
- Session recordings — full browser replay for every test, not just failures
- Bug analysis — functional and usability classifications with reasoning
- Screenshots at the point of failure
- Environment context — URL, browser, viewport, and session ID
- Priority and tags — filter by P0 smoke tests, regression tags, or feature folders
Opening reports locally
After any CLI run:
devassure run-tests
devassure open-report --last
O2 serves a detailed HTML report in your browser. The VS Code extension also keeps the last 20 sessions in the History panel — click any session to open its full report.
If you archived a run from CI:
devassure open-report --archive=./reports/devassure-results.zip
Reports in CI/CD and on pull requests
When O2 runs via GitHub Actions (devassure-ai/devassure-action@v1), results post back as a status check on the PR with pass/fail counts. The full report is archived as a .zip artifact you can download from the workflow run and open with the CLI or VS Code extension.
For Jenkins, CircleCI, GitLab CI, or TeamCity:
devassure run-tests --tag=regression --archive=./reports
Exported JUnit XML integrates with existing CI dashboards. Archived zip files preserve session recordings and step detail for audit and debugging.
TestRail integration
If your team manages cases in TestRail, O2 can post results and attach session recordings directly:
devassure run-tests --provider testrail --post-results --add-defects --attach-videos
Failures create defects with full context — your TestRail workflow stays the same; O2 becomes the execution and reporting engine. Learn more about the TestRail integration →
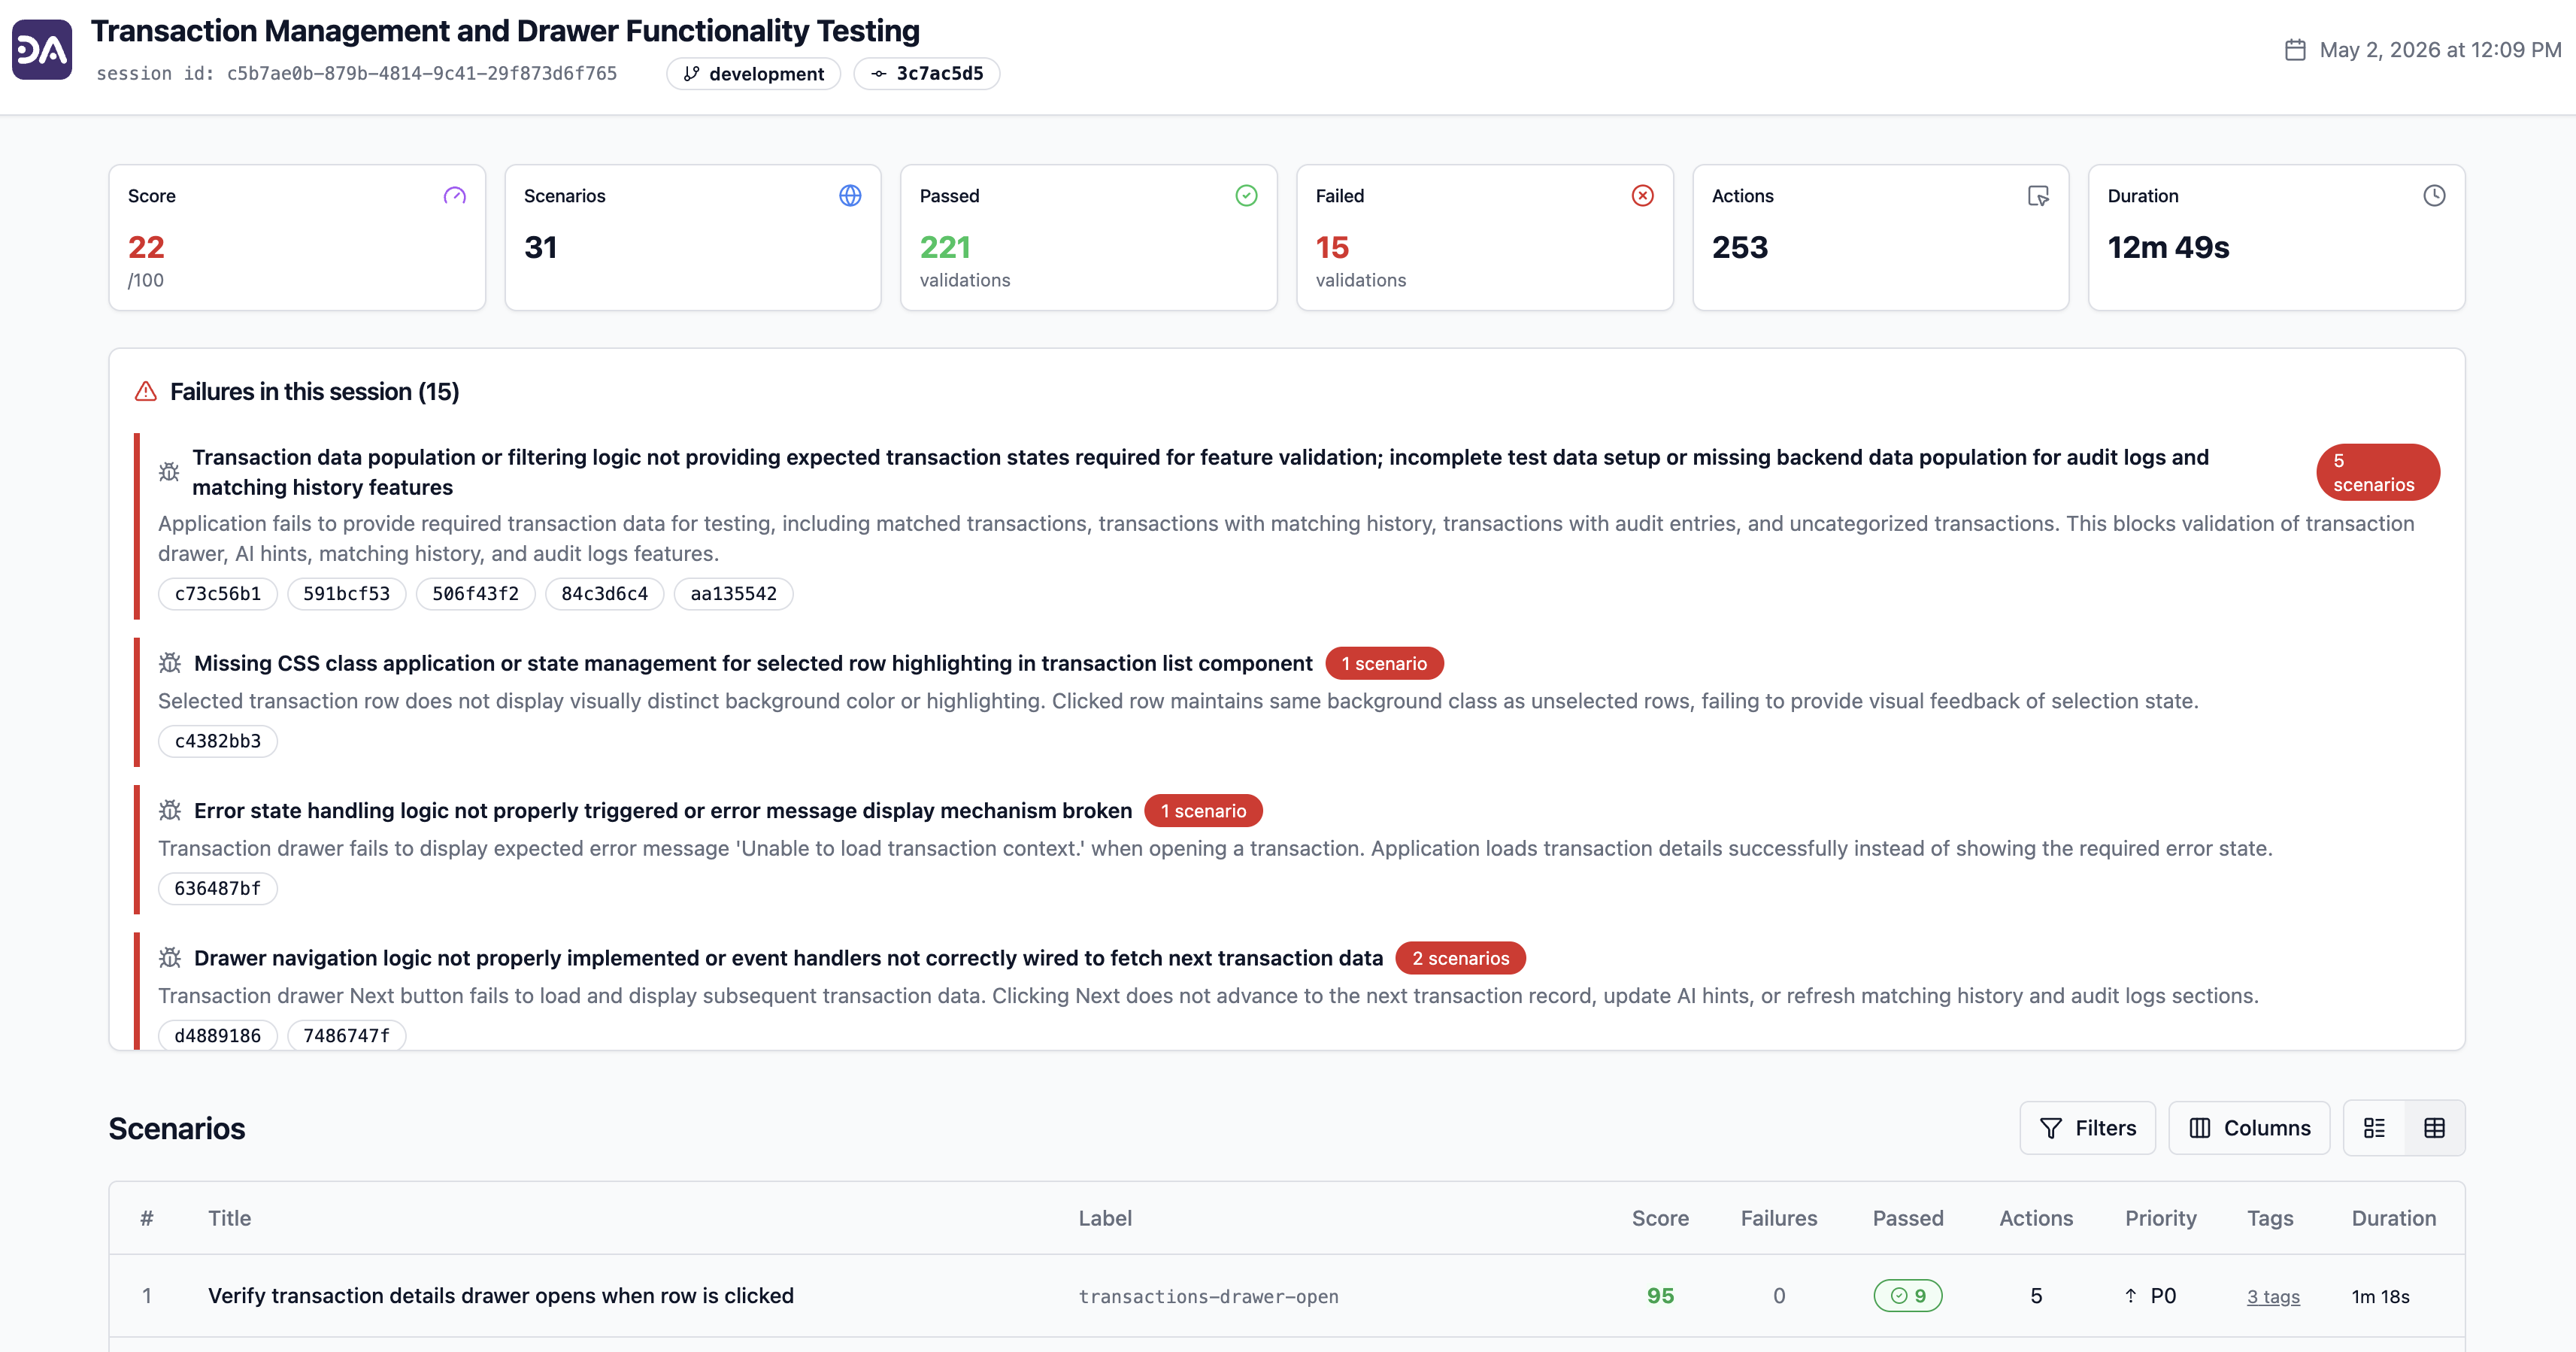
Sample O2 bug analysis report
Learn more about DevAssure O2 →
For PR-native workflows, O2's per-run reports and CI artifacts complement these dashboards: drill into a single PR's session replay when a trend line spikes, then use the platform dashboard to track stability across releases.